
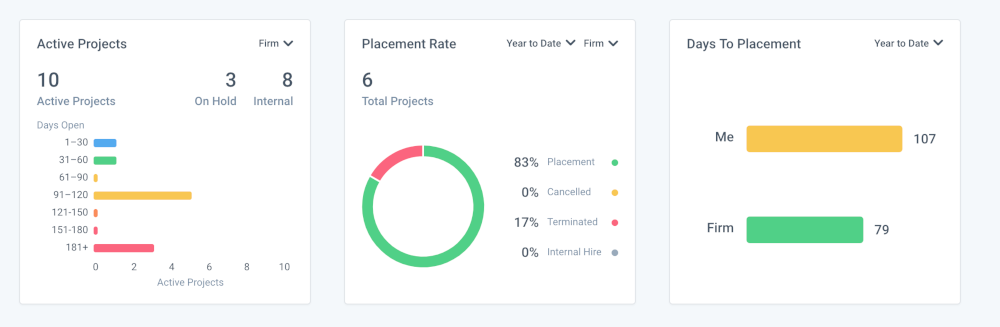
We’re all better off doing what we do best. Clockwork's dashboard frees up time normally spent digging for project data so you can focus on what you do best—recruiting. The dashboard displays the information that matters most to your business front and center: Active Projects, Placement Rate, Days to Placement and Recent Reports.
Clockwork condenses volumes of data into intuitive visualizations so you can quickly see the information you need to make the best decisions to move your business forward. Whether you are looking at your current pipeline or planning next quarter’s strategy, our dashboard provides the most relevant metrics needed to inform your process.
When it’s turned on, you’ll see the dashboard by default when you log into Clockwork. If it’s not turned on, your firm’s admin or partner can follow these instructions to enable it.
Let’s dive a bit deeper into each card, and how they’re built to serve you.
Active Projects
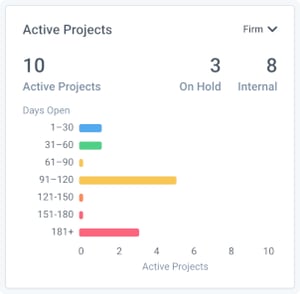 The Active Projects card shows you the volume of active projects as they move through your pipeline. They are grouped by age, with the blue bar showing the newest projects, and the red bar showing the oldest projects—those that are (hopefully!) nearing completion.
This view can help you anticipate swells or dips in your team's workload as projects age into different phases. It also gives you visual motivation to keep your pipeline full.
Placement Rate
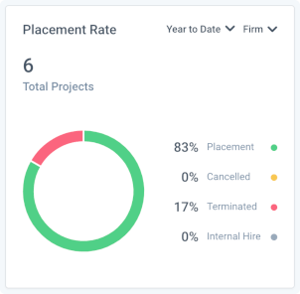 The Placement Rate card displays the percentage of projects over a period of time that have been placed, cancelled, terminated, or resulted in an internal hire. You can toggle between the entire firm’s placement rate or your own personal placement rate.
It’s important to know where you and your firm are in relation to the industry average—explained in Clockwork’s Executive Recruiting Benchmark Report—so you can identify changes needed to get to where you want to be. Our blog features best practice information on executive search strategies, so stay connected to stay on top of your game. While working inside Clockwork, it’s possible to update a closed project in case you haven’t been using these best practices up to this point.
Days to Placement
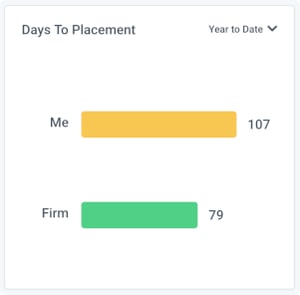 Days to Placement is the other definitive performance metric highlighted in Clockwork’s Executive Recruiting Benchmark Report. This shows how many days on average it takes you and your firm to place a candidate in a project.
The Days to Placement metric is the number clients will look at to determine your firm’s efficiency. Once again, you can select the date range displayed in the card to track improvements over time.
Recent Reports
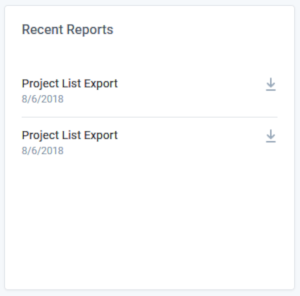 Recent Reports is a real time saver. No need to sort through your projects to grab another copy of that report you just exported yesterday.
Effective time management is crucial to successful executive recruitment, so Clockwork is always looking for ways to save you time.
What else would you like to see on the dashboard? What information do you find yourself accessing the most inside Clockwork? We’re eager to hear your feedback, so head on over to our Ideas page to submit your thoughts or vote on other suggestions.